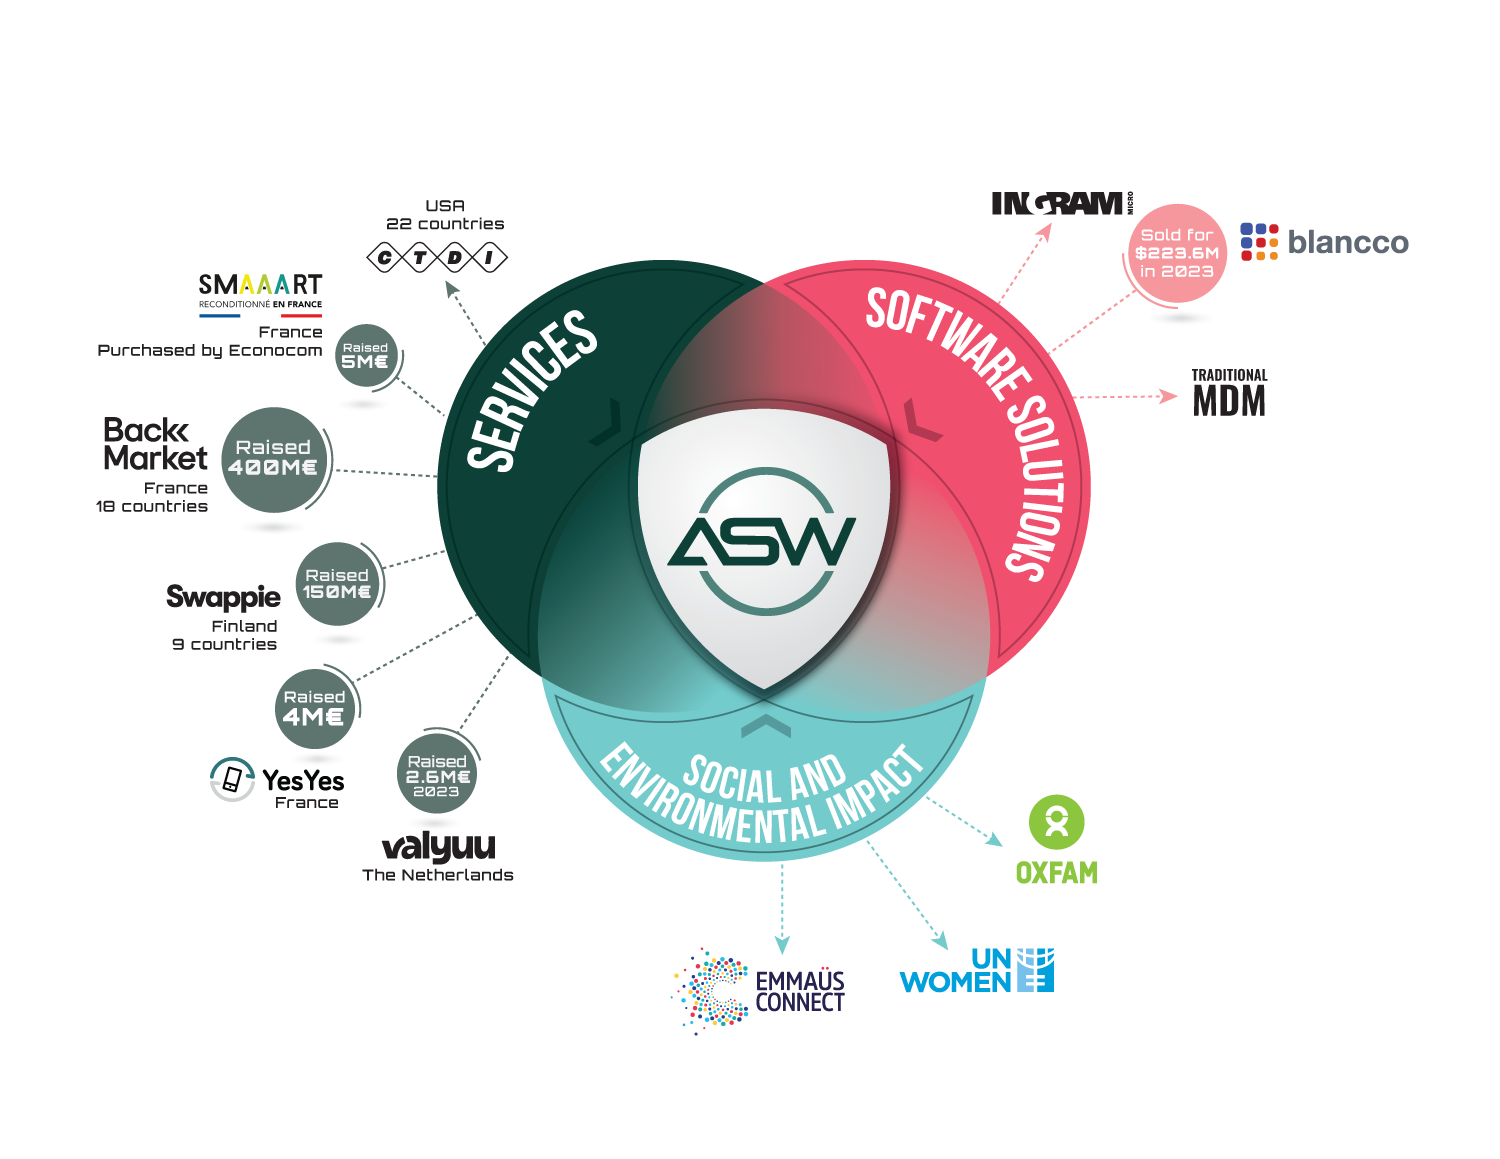
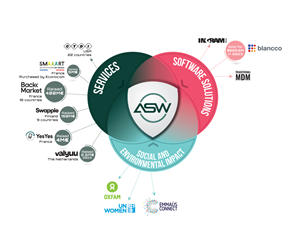
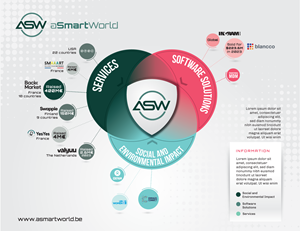
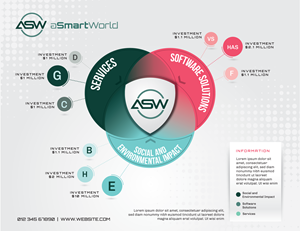
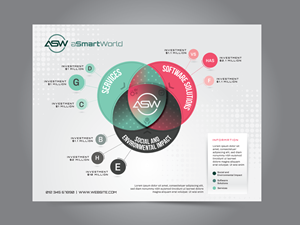
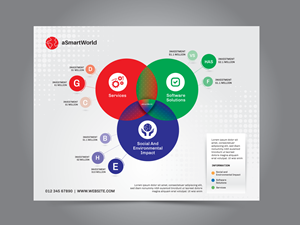
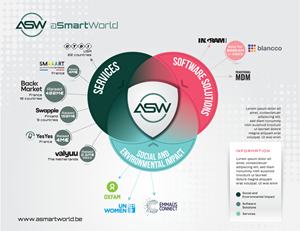
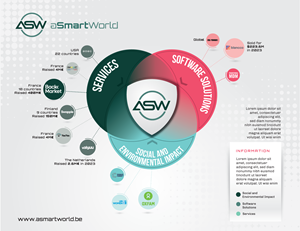
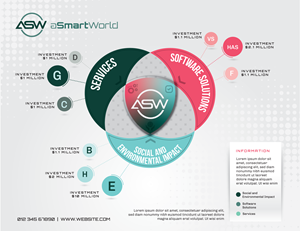
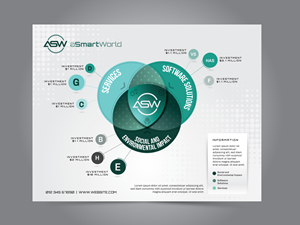
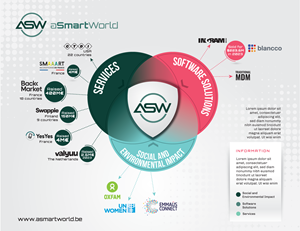
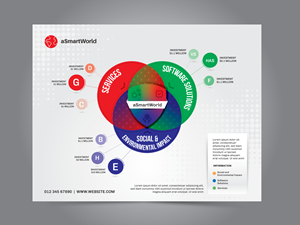
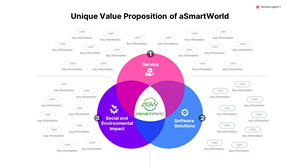
Venn Diagram Highlighting the Unique Value Proposition of aSmartWorld
A business in Belgium needed a infographic design and received 29 Professional, Upmarket, Impact-Tech Startup infographic designs from 3 designers
Designs
Designers
Budget


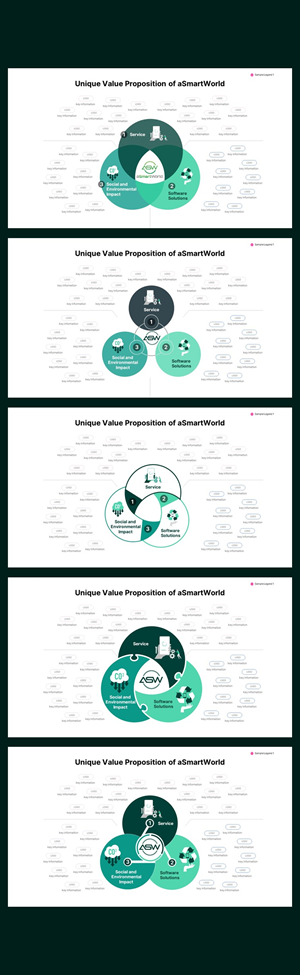


1 - 20 of 29 infographic designs submissions
This is what a business in Belgium was looking for in their infographic design
Objective: Visually represent how aSmartWorld distinguishes itself from its competitors by integrating three key domains:
- Service
- Software Solutions
- Social and Environmental Impact.
Detailed Instructions:
General Design:
• Venn Diagram:
• Create a three-circle Venn diagram, with each circle representing one of the key domains.
• Ensure the circles overlap to show possible intersections between the three domains.
Circles:
• Titles:
• Circle 1: "Service"
• Circle 2: "Software Solutions"
• Circle 3: "Social and Environmental Impact"
• Colors:
• Apply distinct colors to each circle while maintaining a degree of transparency to clearly show overlapping zones.
Competitor Integration:
• Placement:
• Position icons or logos of different competitors around the diagram. For now, indicate each competitor such as :
• A
• B
• C
• D
• E
• F
• G
• H
• I
• Connect each competitor t…
Read more